Understanding the urban ecosystem has the power to influence positive change. The Royal Academy of Engineering asked us to create an interactive, multi-layered digital city, helping city stakeholders better navigate and learn about these urban interactions.
The Royal Academy of Engineering (RAEng) has a clear goal: to advance and promote excellence in engineering for the benefit of society. As the UK’s national academy for engineering, its work spans analysis, policy support, public awareness and education.
As part of its Future Cities programme, RAEng asked us to create an online data visualisation tool – an “interactive city” – that allows users to navigate the urban ecosystem and illustrates how different organisations working together at a systems level can deliver positive change.
Our first task was to think about the editorial approach. Although the tool needed to resonate with urban specialists and policy makers, it was also important that it appealed to a non-expert audience. We worked with the team from the RAEng to gather the material, simplify the story and identity the key messages.
With a good grasp of the content we set about defining what kind of interactive experience we wanted users to have. Our designers and developers started working together from the get-go to sketch out different approaches. This ensured we were taking into consideration how the visualisation could work at different scales on different devices, as well as the little digital touches that would really bring the design to life.
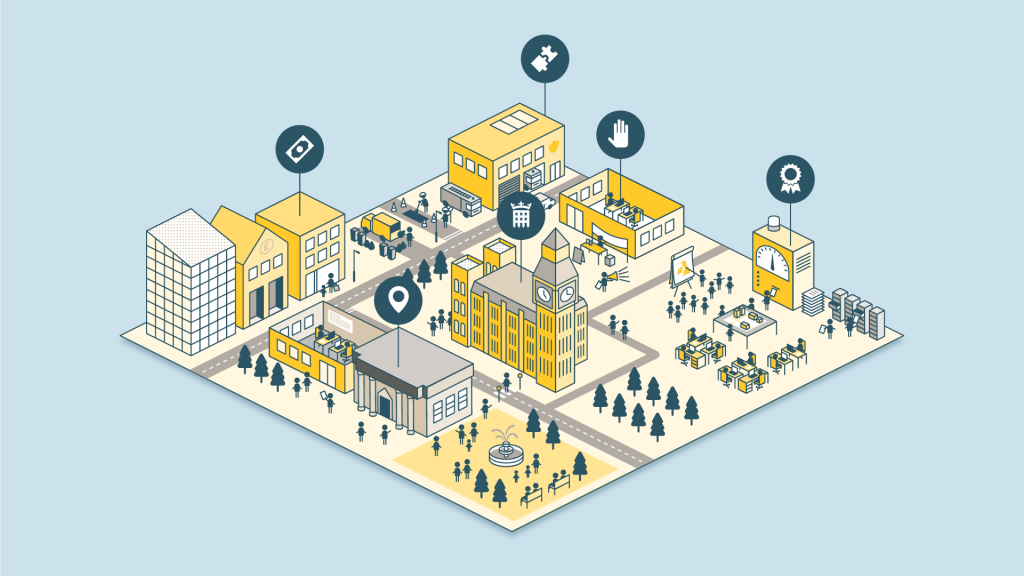
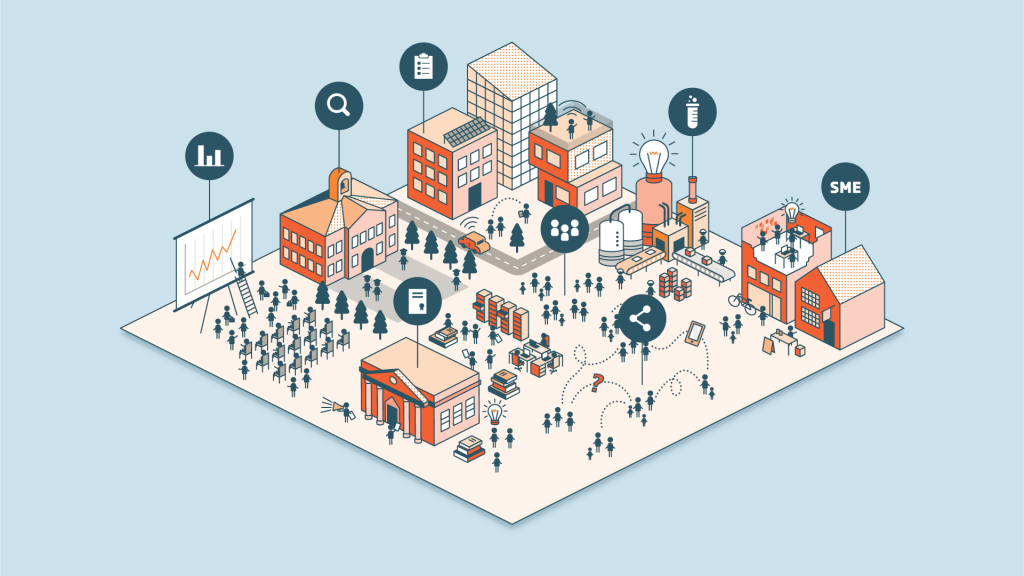
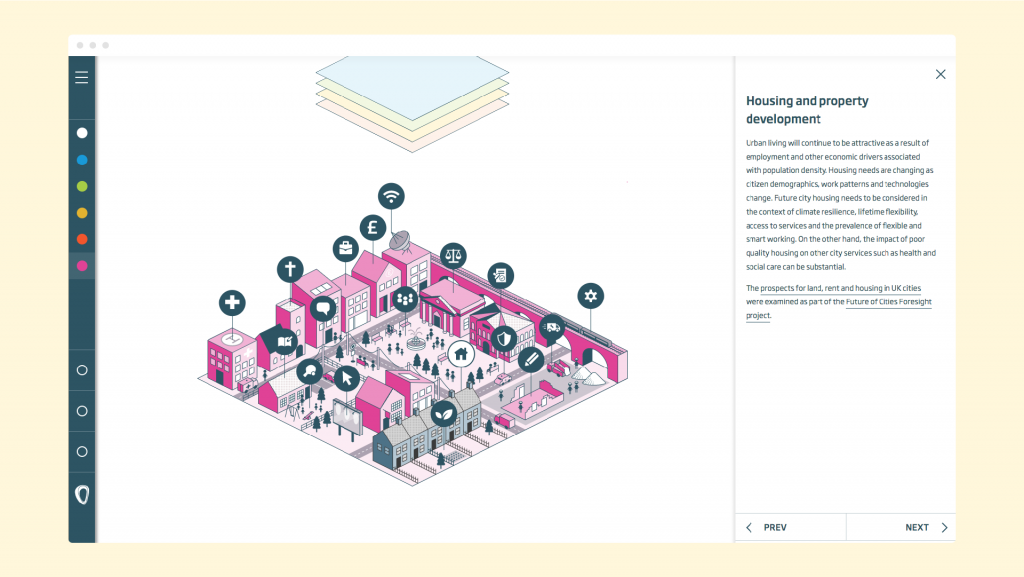
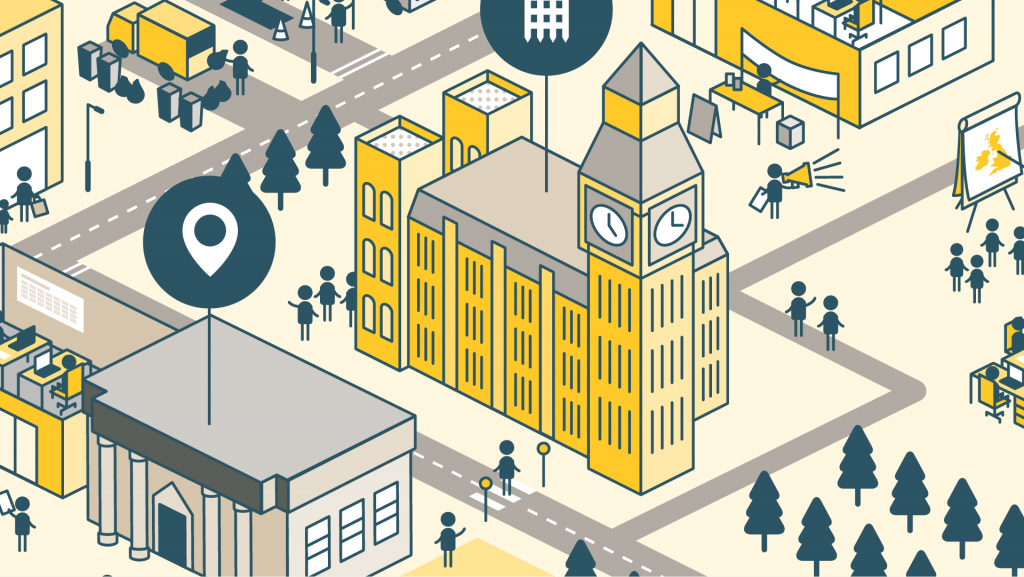
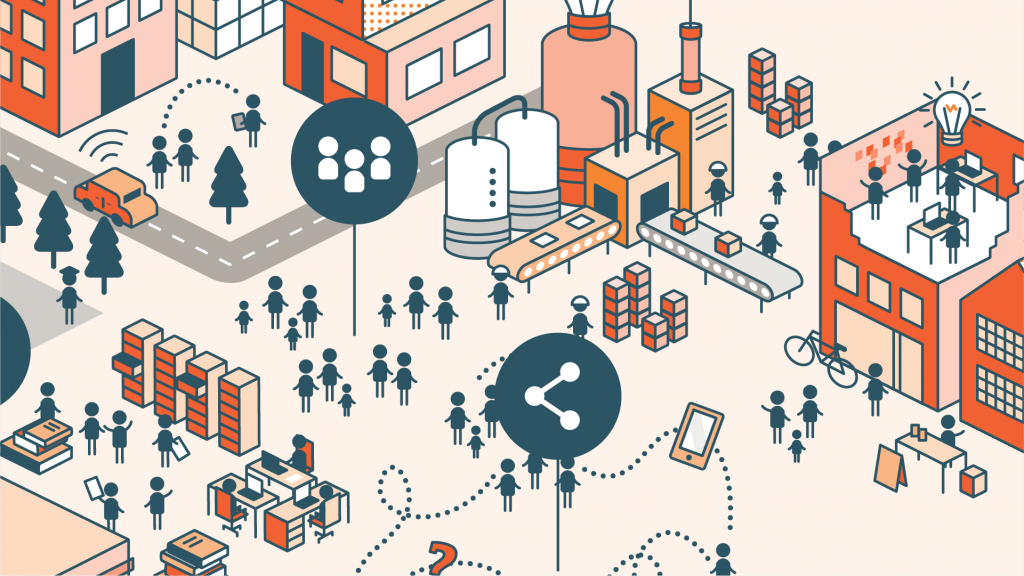
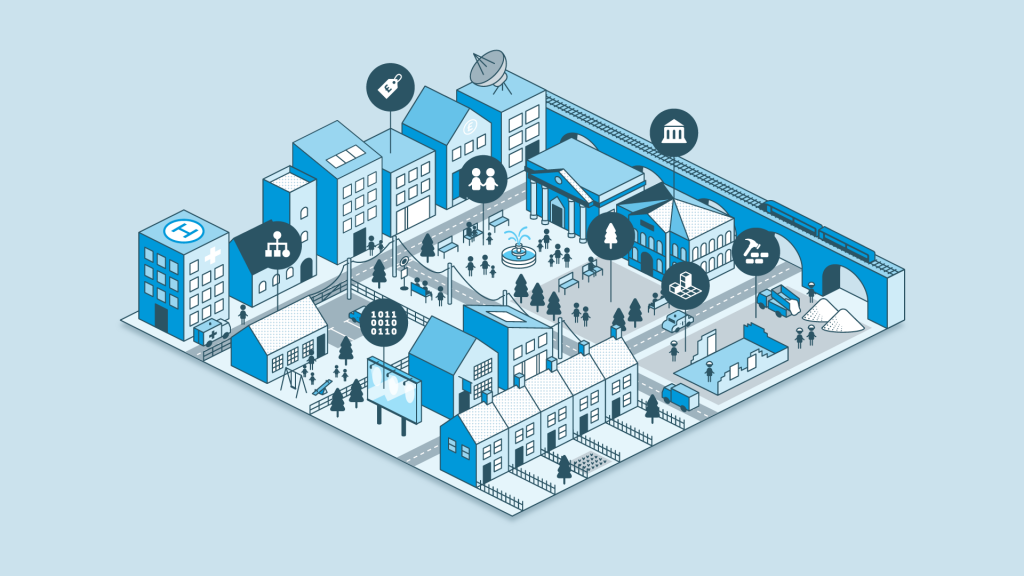
The resulting design uses an isometric illustration style, encouraging the user to dive into the layers of the urban systems and explore the organisations, capabilities and key actors involved in building a future sustainable city. Combined with simple iconography, this accessible and approachable visual vocabulary helps to guide the reader through the different levels of content.
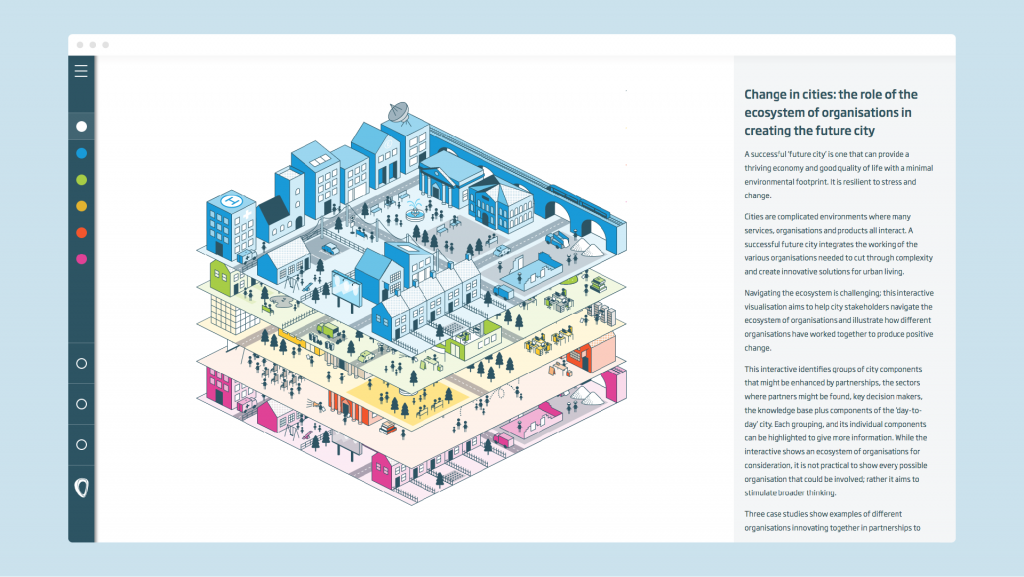
For the visualisation, we designed one image with many different layers. Each layer allows users to dive deeper into decision-making levels in the urban ecosystem. Subtle transitions and animations are built in to help the design really sing.
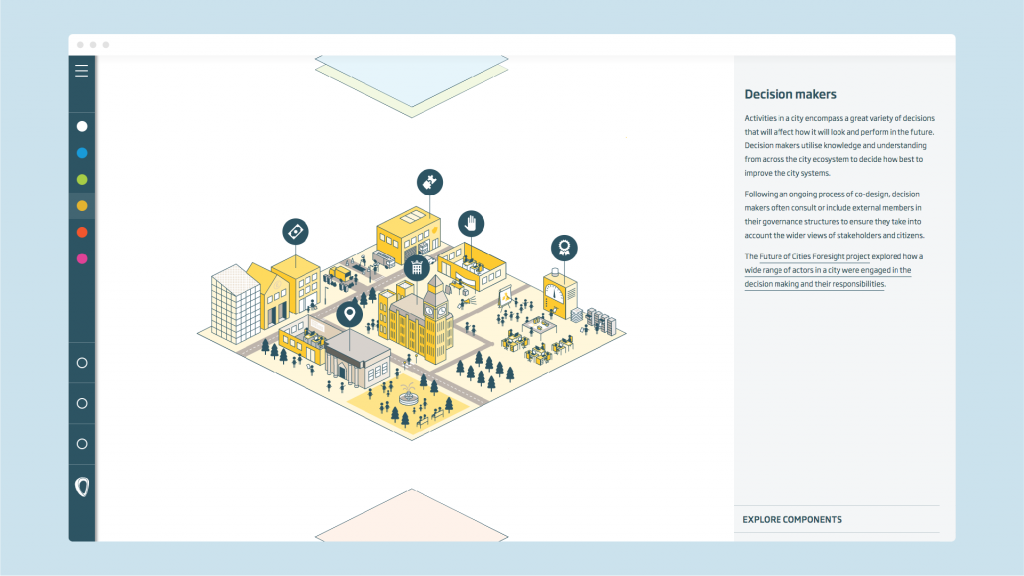
The tool lets users explore for themselves interactions between key decision-makers, the city’s knowledge base, and the day-to-day activities of the city. Designed to stimulate systems-based thinking, this interactive visualisation also features three real-world case studies which demonstrate how different organisations innovate together to enact change.
The goal is that the engaging data visualisation will contribute to building an understanding of the different levels of our urban ecosystem and how they work together, setting us on a path to more equitable and sustainable cities in the future.
Want to explore it for yourself? Head this way.